 | |||||||||||||||||||
| Graphing
Graphing support was added in version 3.2
Additional Prerequisites
Additional Directories2 additional directories need to be created to contain graph data:
Enabling GraphingData from SNMP queries, TCP tests, UDP tests, external program tests, database queries, internal data, ping round-trip-times, test elapsed time, (etc.) can all be graphed. Groups of these can also be graphed. The default is not to graph. To enable, in the desired places, add: graph: yes You can also set various other parameters. For Example:
	Group "Bandwidth Tests" {
		graph:     yes			# turn on graphing
		title:     Bandwidth		# set the graph title
		ylabel:    Bits per second	# label the y-axis
		drawgrid:  yes			# draw a grid
		Service UDP/SNMP {
			label:		Out
			# calc is documented elsewhere, but
			# this will convert the SNMP counter
			# to the average rate in bits/second
			calc:		ave-rate-bits
			hostname:       gw-amb3.example.com
			oid:		ifInOctets.1
			maxvalue:	20000000
			# maxvlue is documented elsewhere, but
			# this will cause the service to be
			# down if it exceeds 20 Mbps
			# when down, the graph will display red
		}
		Service UDP/SNMP {
			label:		In
			calc:		ave-rate-bits
			hostname:       gw-amb3.example.com
			oid:		ifOutOctets.1
			maxvalue:	20000000
		}
	}
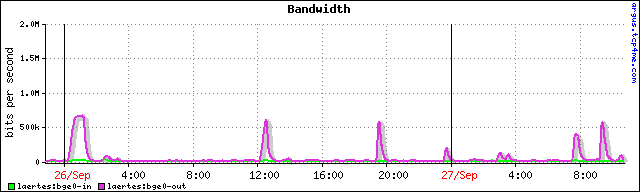
The webpages will contain 3 thumb-nail images covering roughly: 1 day, 2 weeks, 3 months. Clicking on the thumb-nails will bring up a larger image. Some example images, click for larger:
| ||||||||||||||||||
| |||||||||||||||||||